
Swiss solar calculator.
SimulationsThe solar potential of your roof
Locate your home, view possible panels on your roof and get a clear estimate of production, savings and profitability.
Start with your zip code

How are estimates calculated?
The postal code identifies the municipality and the canton; it does not automatically recover your electricity rate. Each tool uses its own scenario, explained below.
- Pronovo
- New installation with self-consumption, 2–29.9 kWp, commissioning 2026, excluding bonus: CHF 360/kWp added or CHF 400/kWp integrated. Check the actual type; other powers and years go through the official tariff calculator. Without known power, the example is 6–12 kWp. Supposed modules of 450 W and approximately 2.2 m².
- Bill
- Without metered consumption: CHF 0.26/kWh and CHF 120 annual fixed costs. Production assumed equal to 90% of annual consumption, self-consumption 30–45%, injection CHF 0.06–0.10/kWh. Fixed costs remain due. The gain excludes system purchase, financing and maintenance.
- Battery
- Capacity based on approximately 30–50 % of daily consumption. Assumptions: 180–250 annual cycles and 90 % storage efficiency. Forgone feed-in income is deducted; sufficient solar surplus and evening consumption are necessary. Neither backup power nor payback time is guaranteed.
- Electric vehicle
- Depending on the category: 14–25 kWh/100 km, then 10% load losses. Assumed solar production of 900–1’100 kWh/kWp and 450 W modules. The result expresses an annual energy equivalence, not a solar recharge available on each trip.
- Roofing
- Map coverage determines the data available; a missing roof is not invented. The savings calculation uses an example of 4’500 kWh consumption, 35 % self-consumption, purchase CHF 0.26/kWh and feed-in CHF 0.08/kWh. Structural suitability, permission and quotes remain to be checked separately.
Estimate your roof's production, project cost, electricity savings and payback time. The results are indicative and must be confirmed by a professional, your GRD and the rules of your canton.
What the solar simulator calculates
1. Production
solar kWh per year
From the roof, orientation, shading and local potential.
2. Savings
Self-consumption and injection
With your consumption and the price hypotheses displayed; compare them to your DNO contract.
3. Profitability
Net cost and estimated return
After quote, Pronovo and local aid confirmed, excluding any unverified subsidy.
Data and privacy
The calculator is not a quote or personalized advice. If you enable the map, your browser contacts Google Maps, Geocoding, and Google Solar API to locate the address and retrieve roof data.

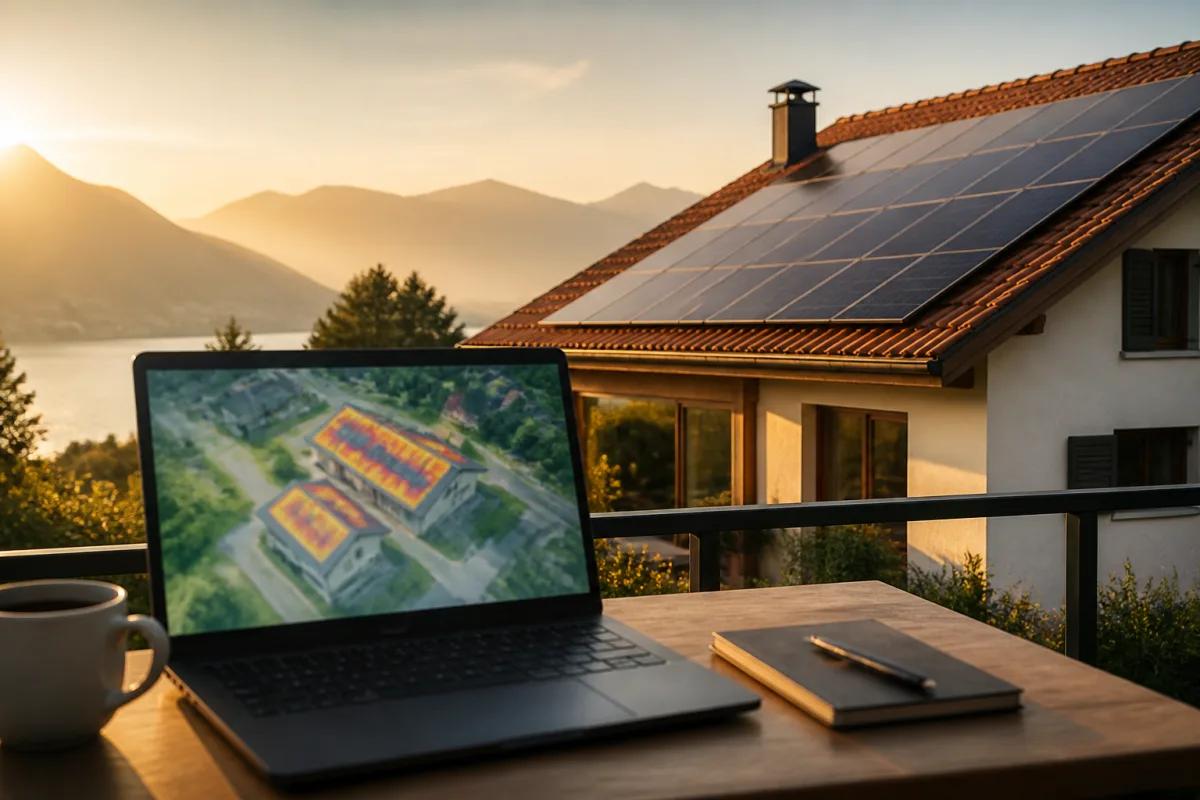
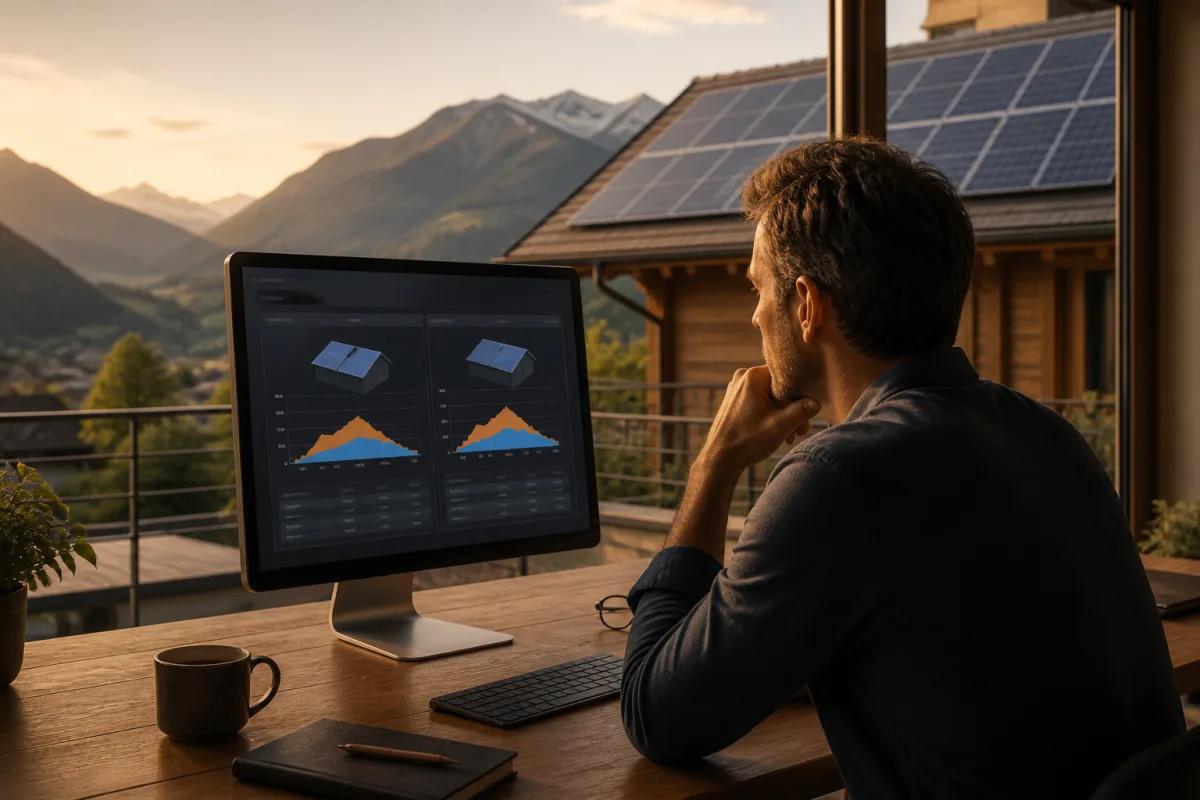

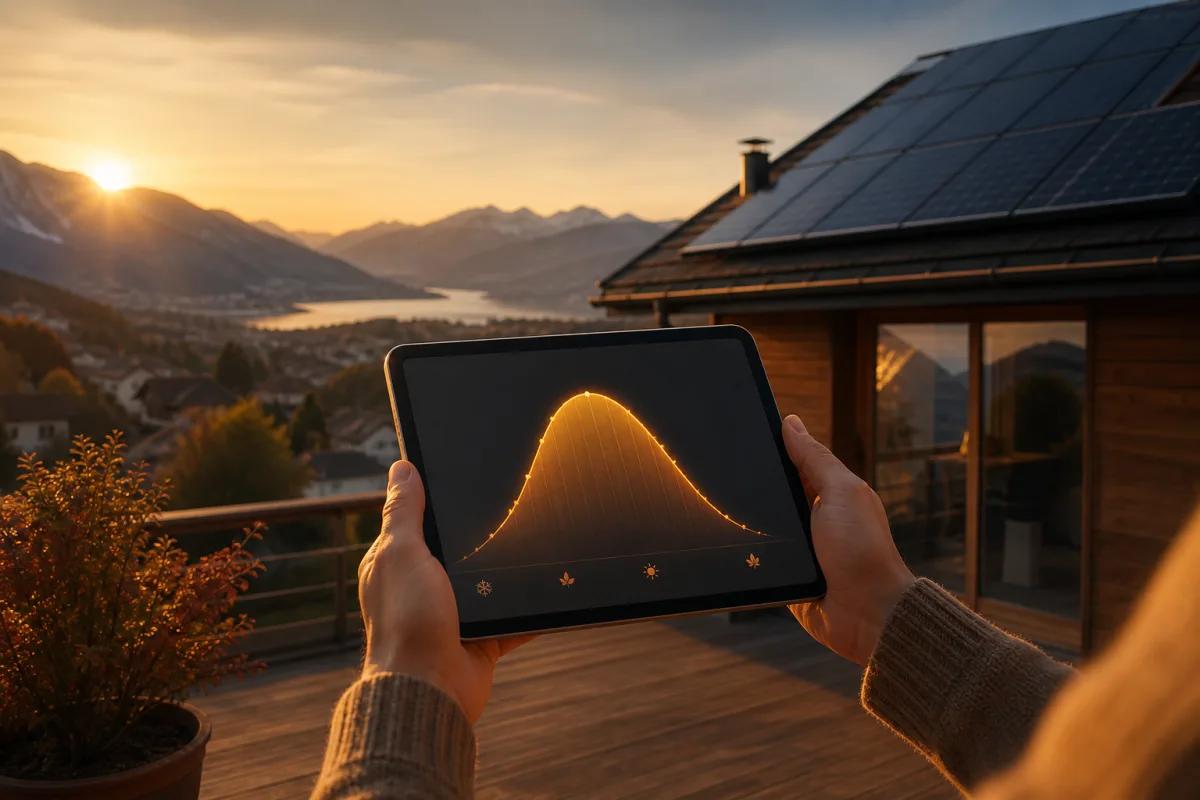

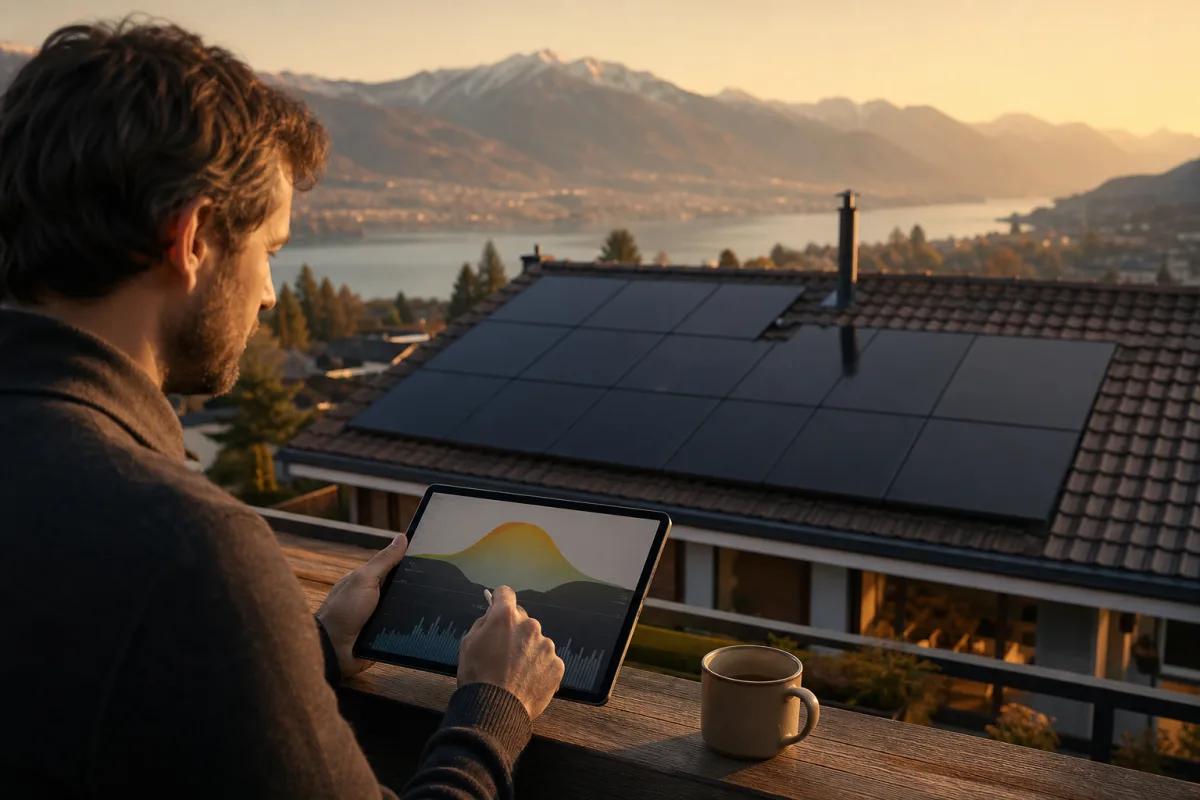
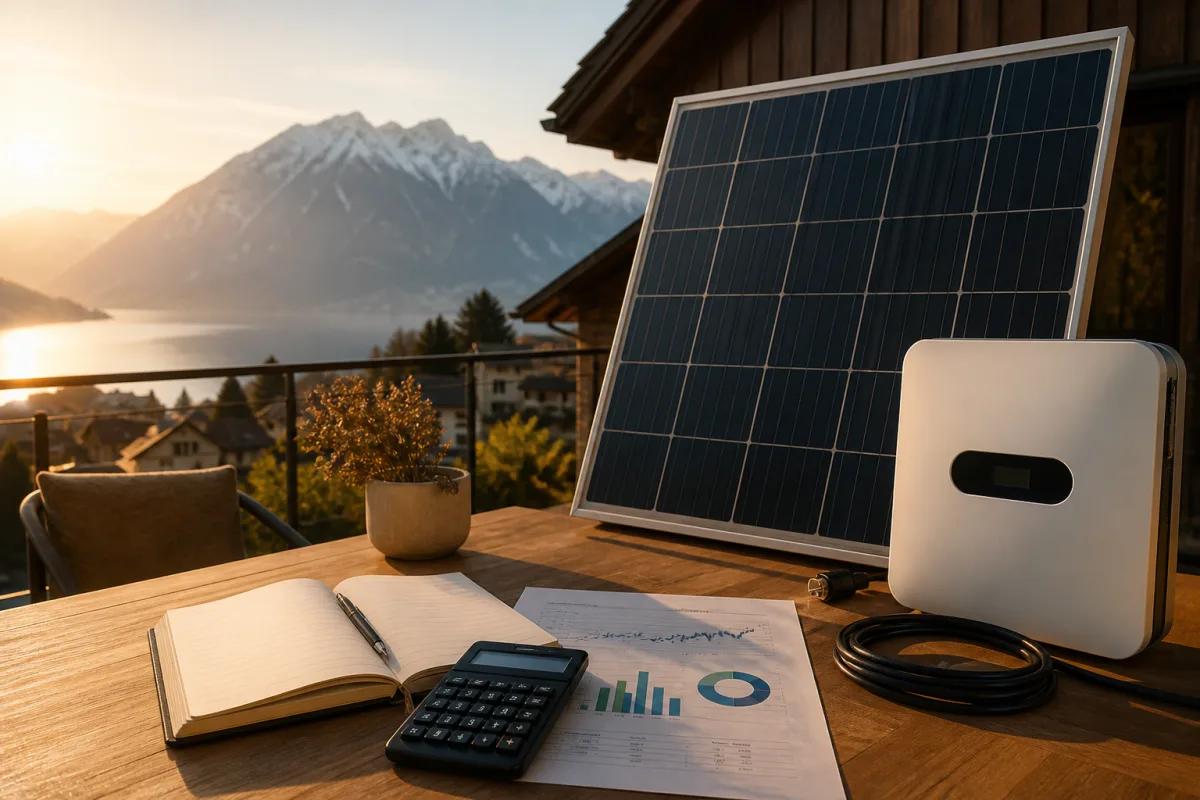

Check your address and receive an estimate of your roof’s solar potential.
Locate your home, view possible panels on your roof and get a clear estimate of production, savings and profitability.
Roofing
Address
Orientation
Confirm
Shading
To take into account
Result
Indicative
Solar Subsidy Calculator
Estimate federal aid using the Pronovo 2026 scale. Local supplements remain to be verified.
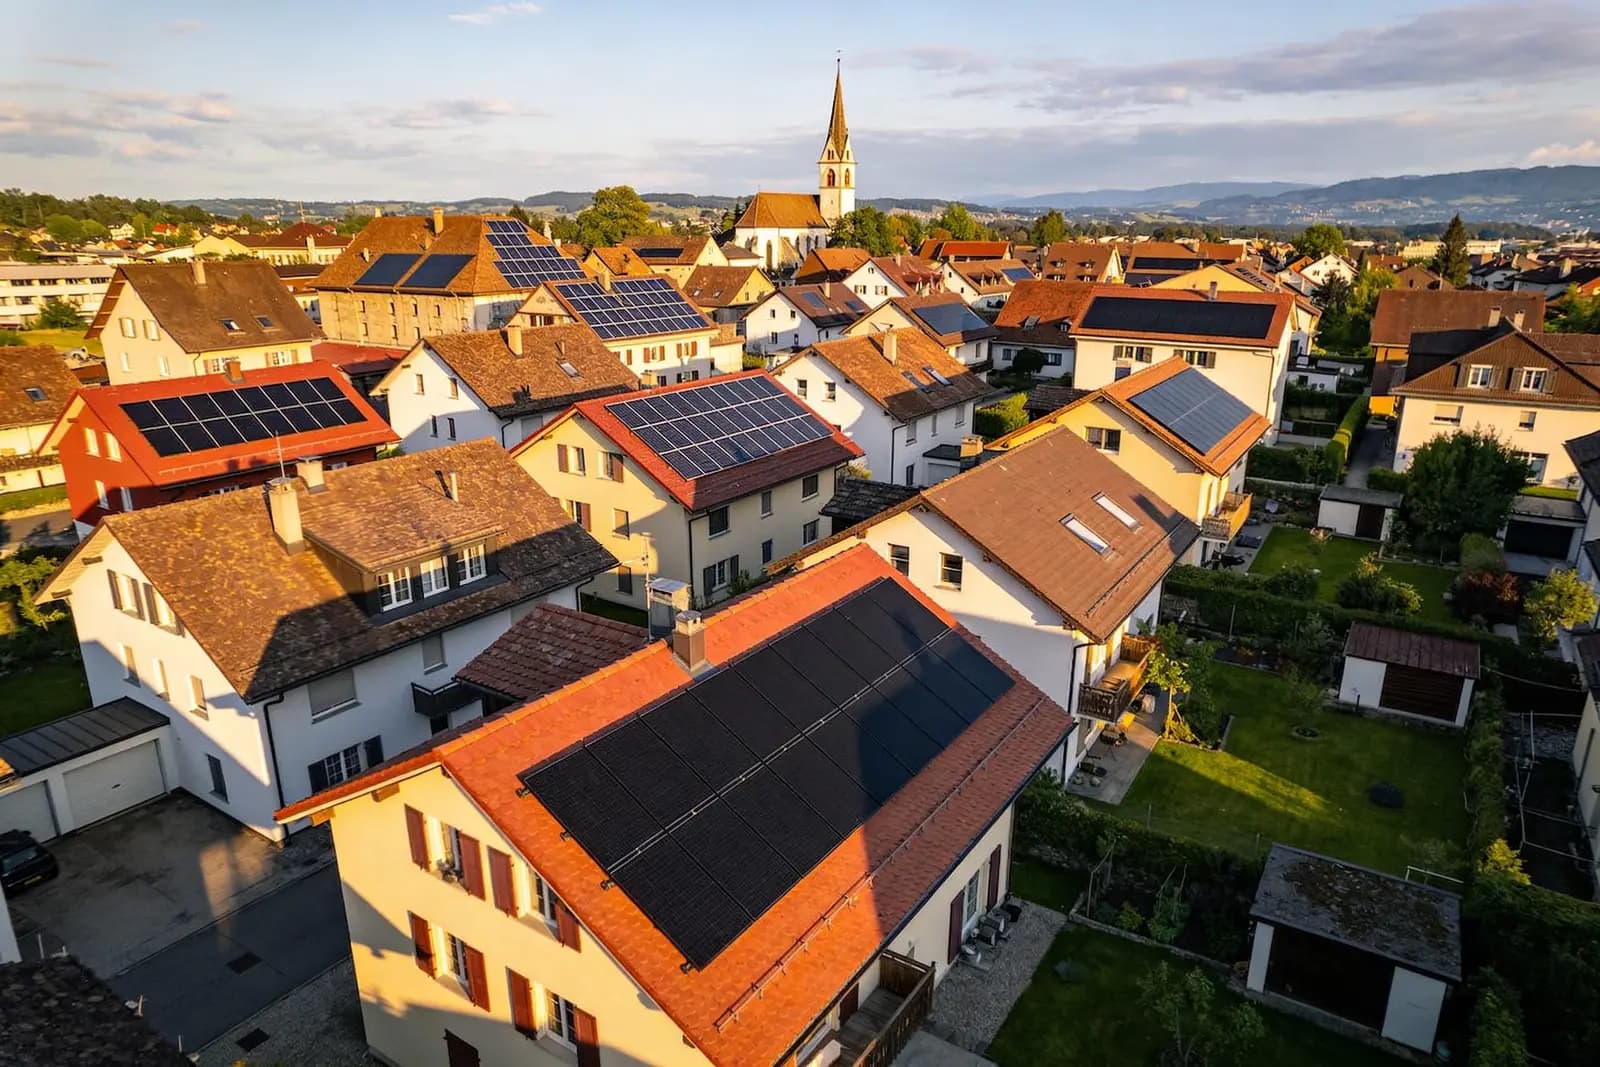
Example installation
9 kWp
Installation
On roof
Pronovo 2026
CHF 3 240
Local aid
Check
Post-solar bill calculator
Compare your annual bill before and after installation according to your consumption and your self-consumption rate.
To start
Monthly bill
Consumption
Optional
Comparison
Over a year
Savings
As a range
In-depth simulation method
A solar calculator is used to frame a decision, not to produce a quote remotely. The quality of the result depends on the data entered, the prices chosen and the way in which the shadows, consumption and aids are modeled. This method helps you use simulations to compare scenarios, identify fragile assumptions and prepare a more precise request for quotation.
Start with the right data
The address provides context, but it alone does not describe the roof. Check usable area, orientation, slope, chimneys, skylights, trees, neighboring buildings and condition of roofing. An aerial view may miss an obstacle or interpret an annex as a main roof. The calculation should indicate which data is measured, which is estimated and which areas have been excluded.
On the consumption side, an annual bill is a first benchmark. Monthly data shows seasonality; hourly or quarter-hourly data show whether the household consumes during production. Heating, hot water, heat pump, charging station, swimming pool and teleworking are significantly changing self-consumption. If your profile is going to change, calculate a current scenario and a future scenario instead of silently replacing a data point with a national average.
- Retain the date and source of each data entered.
- Separate observed consumption, forecast consumption and growth hypothesis.
- Note shadows and non-installable parts of the roof before comparing prices.
Production: look at the curve, not just one number
An estimate of annual production is useful for a first framing, but it can hide a weak winter, a loss of shade or an east-west orientation. Ask for production per month and the main losses: temperature, dirt, cables, inverter, shadows and availability. A lower but explained estimate is better than a high number without assumptions. Always compare the number of modules, their power, the surface area and the simulated production.
The reference weather is not a guarantee for the following year. A very sunny year does not prove that the system will always produce the maximum, and a weak year does not necessarily mean a fault. The calculator must therefore provide a range or at least a conservative scenario. When requesting a quote, convey the same assumption to each installer to compare their technical differences rather than different weather bases.
Self-consumption and injection
Self-consumption is the portion of solar electricity consumed on site. It depends on the time, the power of the devices and the ability to move certain loads. Self-sufficiency is another measure: it indicates how much of your total consumption is covered by your solar. The two percentages should not be confused. A house can self-consume a large part of its production while still needing the network in the mornings and evenings.
The remuneration of the surplus depends on the network operator and the applicable rules. In the calculation, separate the value of a kilowatt hour consumed on site from the value of a kilowatt hour injected. Add the price of energy, the network components that remain due and any metering costs. If a rate changes, you will be able to adjust a cell without redoing the entire simulation. This transparency makes the result more sustainable.
Net cost, aid and financing
A calculator must present the gross cost before displaying assistance. The gross cost includes modules, structure, inverter, cabling, protections, electrical work, roof access, connection and commissioning. Optional items such as the battery, terminal or roof renovation must remain separate. An estimate that mixes them makes it difficult to compare with an actual quote.
Pronovo, cantonal programs, municipalities and taxation do not have the same rules or the same timetable. Possible help should be shown as a guess until confirmed for address and project type. Likewise, a tax benefit depends on your situation and should not be presented as a guaranteed refund. Calculate the return with confirmed help, then separately show a favorable scenario.
Compare scenarios without moving the goalposts
To compare two offers, keep the same roof, the same consumption profile, the same price and the same period. Change one variable at a time: number of modules, orientation, battery, control or price. If an offer shows a better return, check if it assumes greater self-consumption, a different take-back price or no replacement cost. The table should show the hypotheses and not just the conclusion.
Calculate at least one minimal variant, one balanced variant, and one evolving variant. The minimum variant shows the entry cost; the balanced variant meets your use; the scalable variant retains a possibility for the battery, the terminal or the heat pump. This approach avoids choosing an oversized facility for fear of missing a future opportunity, while also avoiding closing a reasonable expansion.
Questions to ask after the result
After a simulation, ask the installer what elements he would confirm on site. He must be able to explain the condition of the roof, distances, shadows, chains, inverter, monthly production, protection, connection and deadline. Also ask what happens if production is lower, if the trade-in price changes or if part of the roof is excluded. A useful estimate produces a checklist, not a false sense of precision.
Keep the file or scenario capture with the date. When you receive an offer, compare its assumptions to those of the calculator. Deviations are not necessarily an error: they can come from a more precise roof measurement, a different orientation or a stricter shading model. The important thing is that the discrepancy is explained and you know which assumption to use for your decision.
Data, confidentiality and limits
If a map or solar potential tool uses an external service, check what data is sent and when. An address, roof position and consumption profile can be sensitive. The calculator must explain what is stored, what remains in the browser and what is transmitted to a map or data provider. This information is a condition of trust, especially when the result then suggests a commercial contact.
Finally, no simulation replaces an electrical, structural or administrative control. It does not guarantee an invoice amount, a return period, a price or a subsidy. Use it to raise the right questions, then have the project confirmed by a detailed offer and by the competent organizations. The best calculator is the one that makes its limits visible and improves the quality of the conversation with the installer.
A solar simulation becomes reliable when its data, assumptions, prices and limits are visible. Use the result to compare scenarios and request a verifiable offer, not to replace the technical visit.